lov2 vector Search Results


92
Addgene inc lov2 vector
Computational design and DMD simulation of <t>N-acyltransferase/LOV2</t> fusion protein.A, ribbon diagram of wildtype N-acyltransferase orf11 protein, enzymatic binding pocket and active site (V197/S236/H196) indicated with a red arrow. B, amino acid conservation score (top), residue exposure (left), and contact map of N-acyltransferase Orf11. Conservation Score is from 1 (Highly Conserved) to 10 (Not Conserved). Selected insertion site (L1) is indicated in red, at a nonconserved and exposed loop. Bottom right, ribbon diagram, and exploded view of selected insertion loop (K187-D188). C, allosteric coupling of NAT residues, calculated by the Ohm online server (https://dokhlab.med.psu.edu/ohm/#/). Selected insertion site (L1) is indicated in red. D, visualization of the predicted allosteric pathway of the selected insertion site, K187-D188. E, final structure of LOV2-inserted N-acyltransferase fusion protein, oNAT. DMD, discrete molecular dynamic; LOV2, light-oxygen-voltage-sensing domain; NAT, N-acyltransferase.
Lov2 Vector, supplied by Addgene inc, used in various techniques. Bioz Stars score: 92/100, based on 1 PubMed citations. ZERO BIAS - scores, article reviews, protocol conditions and more
https://www.bioz.com/result/lov2 vector/product/Addgene inc
Average 92 stars, based on 1 article reviews
lov2 vector - by Bioz Stars, 2026-05
92/100 stars
  Buy from Supplier

91
Addgene inc lov2 rrrg degron tag
Computational design and DMD simulation of <t>N-acyltransferase/LOV2</t> fusion protein.A, ribbon diagram of wildtype N-acyltransferase orf11 protein, enzymatic binding pocket and active site (V197/S236/H196) indicated with a red arrow. B, amino acid conservation score (top), residue exposure (left), and contact map of N-acyltransferase Orf11. Conservation Score is from 1 (Highly Conserved) to 10 (Not Conserved). Selected insertion site (L1) is indicated in red, at a nonconserved and exposed loop. Bottom right, ribbon diagram, and exploded view of selected insertion loop (K187-D188). C, allosteric coupling of NAT residues, calculated by the Ohm online server (https://dokhlab.med.psu.edu/ohm/#/). Selected insertion site (L1) is indicated in red. D, visualization of the predicted allosteric pathway of the selected insertion site, K187-D188. E, final structure of LOV2-inserted N-acyltransferase fusion protein, oNAT. DMD, discrete molecular dynamic; LOV2, light-oxygen-voltage-sensing domain; NAT, N-acyltransferase.
Lov2 Rrrg Degron Tag, supplied by Addgene inc, used in various techniques. Bioz Stars score: 91/100, based on 1 PubMed citations. ZERO BIAS - scores, article reviews, protocol conditions and more
https://www.bioz.com/result/lov2 rrrg degron tag/product/Addgene inc
Average 91 stars, based on 1 article reviews
lov2 rrrg degron tag - by Bioz Stars, 2026-05
91/100 stars
  Buy from Supplier

93
Addgene inc ptriex vector 6
Computational design and DMD simulation of <t>N-acyltransferase/LOV2</t> fusion protein.A, ribbon diagram of wildtype N-acyltransferase orf11 protein, enzymatic binding pocket and active site (V197/S236/H196) indicated with a red arrow. B, amino acid conservation score (top), residue exposure (left), and contact map of N-acyltransferase Orf11. Conservation Score is from 1 (Highly Conserved) to 10 (Not Conserved). Selected insertion site (L1) is indicated in red, at a nonconserved and exposed loop. Bottom right, ribbon diagram, and exploded view of selected insertion loop (K187-D188). C, allosteric coupling of NAT residues, calculated by the Ohm online server (https://dokhlab.med.psu.edu/ohm/#/). Selected insertion site (L1) is indicated in red. D, visualization of the predicted allosteric pathway of the selected insertion site, K187-D188. E, final structure of LOV2-inserted N-acyltransferase fusion protein, oNAT. DMD, discrete molecular dynamic; LOV2, light-oxygen-voltage-sensing domain; NAT, N-acyltransferase.
Ptriex Vector 6, supplied by Addgene inc, used in various techniques. Bioz Stars score: 93/100, based on 1 PubMed citations. ZERO BIAS - scores, article reviews, protocol conditions and more
https://www.bioz.com/result/ptriex vector 6/product/Addgene inc
Average 93 stars, based on 1 article reviews
ptriex vector 6 - by Bioz Stars, 2026-05
93/100 stars
  Buy from Supplier

93
Addgene inc piggybac vector ppbcag ntom20 moxbfp gs lov2 ires puro
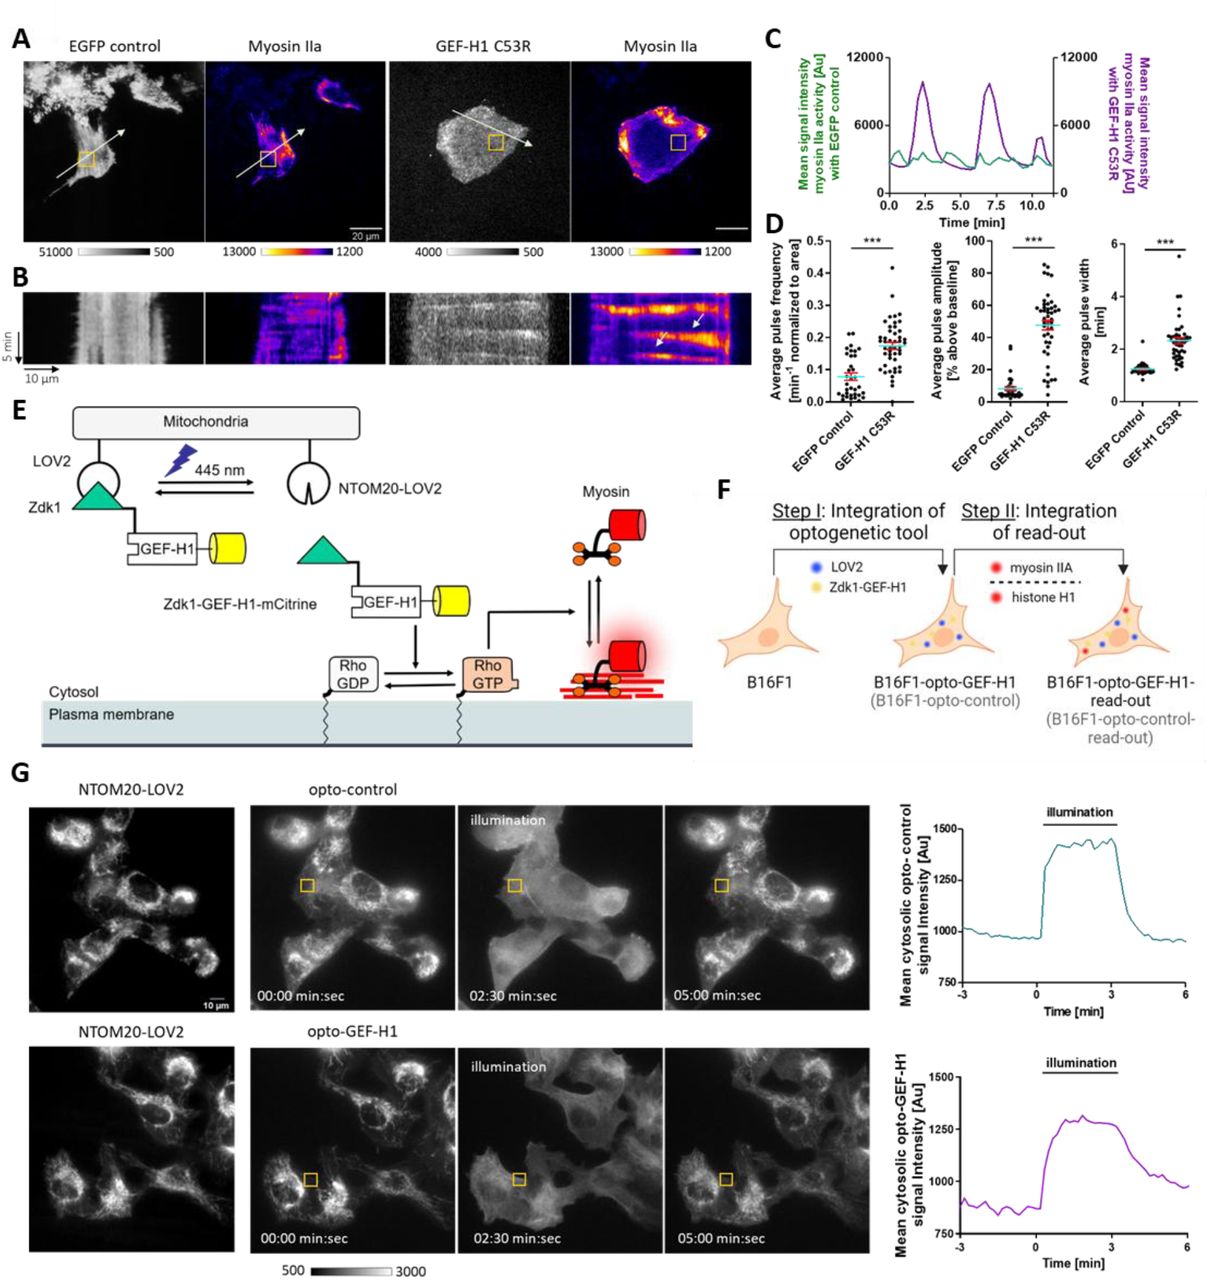
(A-D) Increased expression of a constitutively active GEF-H1 mutant in B16F1 mouse melanoma cells leads to enhanced cell contraction dynamics. (A) Representative TIRF images of cells transiently expressing myosin IIa (pCMV-mCherry-MHC IIA) together with the constitutively active GEF-H1 C53R mutant (pCMV5-EGFP-GEF-HI C53R) or a control vector (pEGFP-N1), respectively. Scale bar = 20 μm. (B) Corresponding kymograph analysis along the arrows in A. (C) Myosin IIa signal intensity plots corresponding to the orange box in A. (D) Quantification of average contraction pulse frequency, amplitude and width. N=41 GEF-H1 C53R cells and N=24 control cells from 3 independent experiments, Error bars represent S.E.M., Unpaired t-test. (E) Schematic representation of optogenetic GEF-H1 release from the mitochondria into the cytosol and subsequent stimulation of cell contraction dynamics by myosin IIa. (F) Schematic representation of stepwise strategy to generate stable B16F1 cell lines expressing a GEF-H1-coupled optogenetic tool, the corresponding control and fluorescently tagged read-out proteins. (G) Left: Representative epifluorescence images showing the mitochondrial anchored photo-sensitive <t>LOV2</t> domain <t>(NTOM20-moxBFP-LOV2)</t> and opto-control (mCitrine-Zdk1), or opto-GEF-H1 (mCitrine-Zdk1-GEF-H1 C53R) before, during and after optogenetic stimulation at 445-488 nm. Scale bar = 10 μm. Right: Intensity plots of opto-control and opto-GEF-H1 signal corresponding to the orange boxes in left panels.
Piggybac Vector Ppbcag Ntom20 Moxbfp Gs Lov2 Ires Puro, supplied by Addgene inc, used in various techniques. Bioz Stars score: 93/100, based on 1 PubMed citations. ZERO BIAS - scores, article reviews, protocol conditions and more
https://www.bioz.com/result/piggybac vector ppbcag ntom20 moxbfp gs lov2 ires puro/product/Addgene inc
Average 93 stars, based on 1 article reviews
piggybac vector ppbcag ntom20 moxbfp gs lov2 ires puro - by Bioz Stars, 2026-05
93/100 stars
  Buy from Supplier

Image Search Results


Computational design and DMD simulation of N-acyltransferase/LOV2 fusion protein.A, ribbon diagram of wildtype N-acyltransferase orf11 protein, enzymatic binding pocket and active site (V197/S236/H196) indicated with a red arrow. B, amino acid conservation score (top), residue exposure (left), and contact map of N-acyltransferase Orf11. Conservation Score is from 1 (Highly Conserved) to 10 (Not Conserved). Selected insertion site (L1) is indicated in red, at a nonconserved and exposed loop. Bottom right, ribbon diagram, and exploded view of selected insertion loop (K187-D188). C, allosteric coupling of NAT residues, calculated by the Ohm online server (https://dokhlab.med.psu.edu/ohm/#/). Selected insertion site (L1) is indicated in red. D, visualization of the predicted allosteric pathway of the selected insertion site, K187-D188. E, final structure of LOV2-inserted N-acyltransferase fusion protein, oNAT. DMD, discrete molecular dynamic; LOV2, light-oxygen-voltage-sensing domain; NAT, N-acyltransferase.

Journal: The Journal of Biological Chemistry

Article Title: An engineered N -acyltransferase-LOV2 domain fusion protein enables light-inducible allosteric control of enzymatic activity

doi: 10.1016/j.jbc.2023.103069

Figure Lengend Snippet: Computational design and DMD simulation of N-acyltransferase/LOV2 fusion protein.A, ribbon diagram of wildtype N-acyltransferase orf11 protein, enzymatic binding pocket and active site (V197/S236/H196) indicated with a red arrow. B, amino acid conservation score (top), residue exposure (left), and contact map of N-acyltransferase Orf11. Conservation Score is from 1 (Highly Conserved) to 10 (Not Conserved). Selected insertion site (L1) is indicated in red, at a nonconserved and exposed loop. Bottom right, ribbon diagram, and exploded view of selected insertion loop (K187-D188). C, allosteric coupling of NAT residues, calculated by the Ohm online server (https://dokhlab.med.psu.edu/ohm/#/). Selected insertion site (L1) is indicated in red. D, visualization of the predicted allosteric pathway of the selected insertion site, K187-D188. E, final structure of LOV2-inserted N-acyltransferase fusion protein, oNAT. DMD, discrete molecular dynamic; LOV2, light-oxygen-voltage-sensing domain; NAT, N-acyltransferase.

Article Snippet: NAT (Orf11/∗Dbv8) was synthesized by Genscript (Genscript Biotech Corp), LOV2 vector was purchased from Addgene (Addgene plasmid #87356).

Techniques: Binding Assay

Spectroscopic characterization of oNAT.A, circular dichroism measurement of wildtype NAT (black), oNAT (blue), oNAT-L (green), and oNAT-D (gray). B, secondary structure composition of wildtype NAT (black), oNAT (blue), calculated wildtype NAT + LOV2 (white), oNAT-L (green), and oNAT-D (gray). C, Tm measurement of wildtype NAT (black), oNAT (blue), oNAT-L (green), and oNAT-D (gray). D, size-exclusion chromatography of wildtype NAT (black), oNAT (blue), oNAT-L (green), and oNAT-D (gray). All measurements were collected in an optically isolated environment. CD, circular dichroism; NAT, N-acyltransferase.

Journal: The Journal of Biological Chemistry

Article Title: An engineered N -acyltransferase-LOV2 domain fusion protein enables light-inducible allosteric control of enzymatic activity

doi: 10.1016/j.jbc.2023.103069

Figure Lengend Snippet: Spectroscopic characterization of oNAT.A, circular dichroism measurement of wildtype NAT (black), oNAT (blue), oNAT-L (green), and oNAT-D (gray). B, secondary structure composition of wildtype NAT (black), oNAT (blue), calculated wildtype NAT + LOV2 (white), oNAT-L (green), and oNAT-D (gray). C, Tm measurement of wildtype NAT (black), oNAT (blue), oNAT-L (green), and oNAT-D (gray). D, size-exclusion chromatography of wildtype NAT (black), oNAT (blue), oNAT-L (green), and oNAT-D (gray). All measurements were collected in an optically isolated environment. CD, circular dichroism; NAT, N-acyltransferase.

Article Snippet: NAT (Orf11/∗Dbv8) was synthesized by Genscript (Genscript Biotech Corp), LOV2 vector was purchased from Addgene (Addgene plasmid #87356).

Techniques: Size-exclusion Chromatography, Isolation

(A-D) Increased expression of a constitutively active GEF-H1 mutant in B16F1 mouse melanoma cells leads to enhanced cell contraction dynamics. (A) Representative TIRF images of cells transiently expressing myosin IIa (pCMV-mCherry-MHC IIA) together with the constitutively active GEF-H1 C53R mutant (pCMV5-EGFP-GEF-HI C53R) or a control vector (pEGFP-N1), respectively. Scale bar = 20 μm. (B) Corresponding kymograph analysis along the arrows in A. (C) Myosin IIa signal intensity plots corresponding to the orange box in A. (D) Quantification of average contraction pulse frequency, amplitude and width. N=41 GEF-H1 C53R cells and N=24 control cells from 3 independent experiments, Error bars represent S.E.M., Unpaired t-test. (E) Schematic representation of optogenetic GEF-H1 release from the mitochondria into the cytosol and subsequent stimulation of cell contraction dynamics by myosin IIa. (F) Schematic representation of stepwise strategy to generate stable B16F1 cell lines expressing a GEF-H1-coupled optogenetic tool, the corresponding control and fluorescently tagged read-out proteins. (G) Left: Representative epifluorescence images showing the mitochondrial anchored photo-sensitive LOV2 domain (NTOM20-moxBFP-LOV2) and opto-control (mCitrine-Zdk1), or opto-GEF-H1 (mCitrine-Zdk1-GEF-H1 C53R) before, during and after optogenetic stimulation at 445-488 nm. Scale bar = 10 μm. Right: Intensity plots of opto-control and opto-GEF-H1 signal corresponding to the orange boxes in left panels.

Journal: bioRxiv

Article Title: Optogenetic stimulation of Lbc GEF-mediated Rho activity dynamics promotes cell invasion

doi: 10.1101/2025.03.28.646036

Figure Lengend Snippet: (A-D) Increased expression of a constitutively active GEF-H1 mutant in B16F1 mouse melanoma cells leads to enhanced cell contraction dynamics. (A) Representative TIRF images of cells transiently expressing myosin IIa (pCMV-mCherry-MHC IIA) together with the constitutively active GEF-H1 C53R mutant (pCMV5-EGFP-GEF-HI C53R) or a control vector (pEGFP-N1), respectively. Scale bar = 20 μm. (B) Corresponding kymograph analysis along the arrows in A. (C) Myosin IIa signal intensity plots corresponding to the orange box in A. (D) Quantification of average contraction pulse frequency, amplitude and width. N=41 GEF-H1 C53R cells and N=24 control cells from 3 independent experiments, Error bars represent S.E.M., Unpaired t-test. (E) Schematic representation of optogenetic GEF-H1 release from the mitochondria into the cytosol and subsequent stimulation of cell contraction dynamics by myosin IIa. (F) Schematic representation of stepwise strategy to generate stable B16F1 cell lines expressing a GEF-H1-coupled optogenetic tool, the corresponding control and fluorescently tagged read-out proteins. (G) Left: Representative epifluorescence images showing the mitochondrial anchored photo-sensitive LOV2 domain (NTOM20-moxBFP-LOV2) and opto-control (mCitrine-Zdk1), or opto-GEF-H1 (mCitrine-Zdk1-GEF-H1 C53R) before, during and after optogenetic stimulation at 445-488 nm. Scale bar = 10 μm. Right: Intensity plots of opto-control and opto-GEF-H1 signal corresponding to the orange boxes in left panels.

Article Snippet: To generate the PiggyBac vector pPBCAG-NTOM20-moxBFP-GS-LOV2-IRES-Puro for expression of the mitochondrial-targeted LOV2 domain, the fluorescent moxBFP tag (Addgene plasmid #68064; ) was amplified together with a GSGSGS linker sequence via PCR and inserted into pTriEx-NTOM20-mVenus-LOV2 (kind gift from Klaus Hahn, University of North Carolina, Chapel Hill, USA) using BamHI and BseRI restriction sites and Gibson assembly.

Techniques: Expressing, Mutagenesis, Control, Plasmid Preparation